Table of contents
If I had to keep one view for deciding where to spend SEO time, I’d take demand against captured share over a ranking report.
Rankings tell you where a page sits for a query. Useful, but narrow. Demand and share tell you how much opportunity exists around a topic and how much of it you’re actually winning.
That is much closer to the question most teams are trying to answer: where is the headroom?
The useful quadrant
Plot market demand on one axis and your captured share on the other, then look at it by topic or cluster.
High demand and high share is a strong position. Protect it. High share in a low-demand area can be perfectly healthy, but there may not be much more to win. Low demand and low share is usually a low priority unless the topic matters strategically.
The interesting area is high demand with low share.
That’s where the market is already telling you the opportunity exists, but your site isn’t capturing much of it. It gives you a much better starting point than sorting a keyword export by search volume and hoping the biggest number is the best opportunity.
Why rank can hide the gap
A page can rank well for the obvious head term and still have weak share across the wider topic. It might be missing long-tail demand, losing clicks to changing SERP features, or splitting visibility with another page.
A single position won’t show that.
Demand against share also makes decline easier to spot. If demand is rising and your captured share is flat, you’re losing relative ground even if traffic hasn’t fallen yet. That is the kind of signal worth seeing early.
Turning the view into work
The reason more teams don’t use this view is simple: keeping it current is awkward. You need demand data, your own search data and a consistent way to group and compare the two.
Once that’s in place, prioritisation gets much easier. Start with the high-demand, low-share areas, then look at where the gap is realistically recoverable. Not every gap is worth chasing, and commercial relevance still matters.
That’s an important final filter. A huge demand gap around a topic with little connection to what you sell can be less useful than a smaller gap around a service that regularly becomes revenue. The chart narrows the field. It doesn’t replace judgment.
Demand and Trends is built around this view, and the operating-system model is the broader idea behind keeping it current. The opportunities view turns the gap into a ranked list.
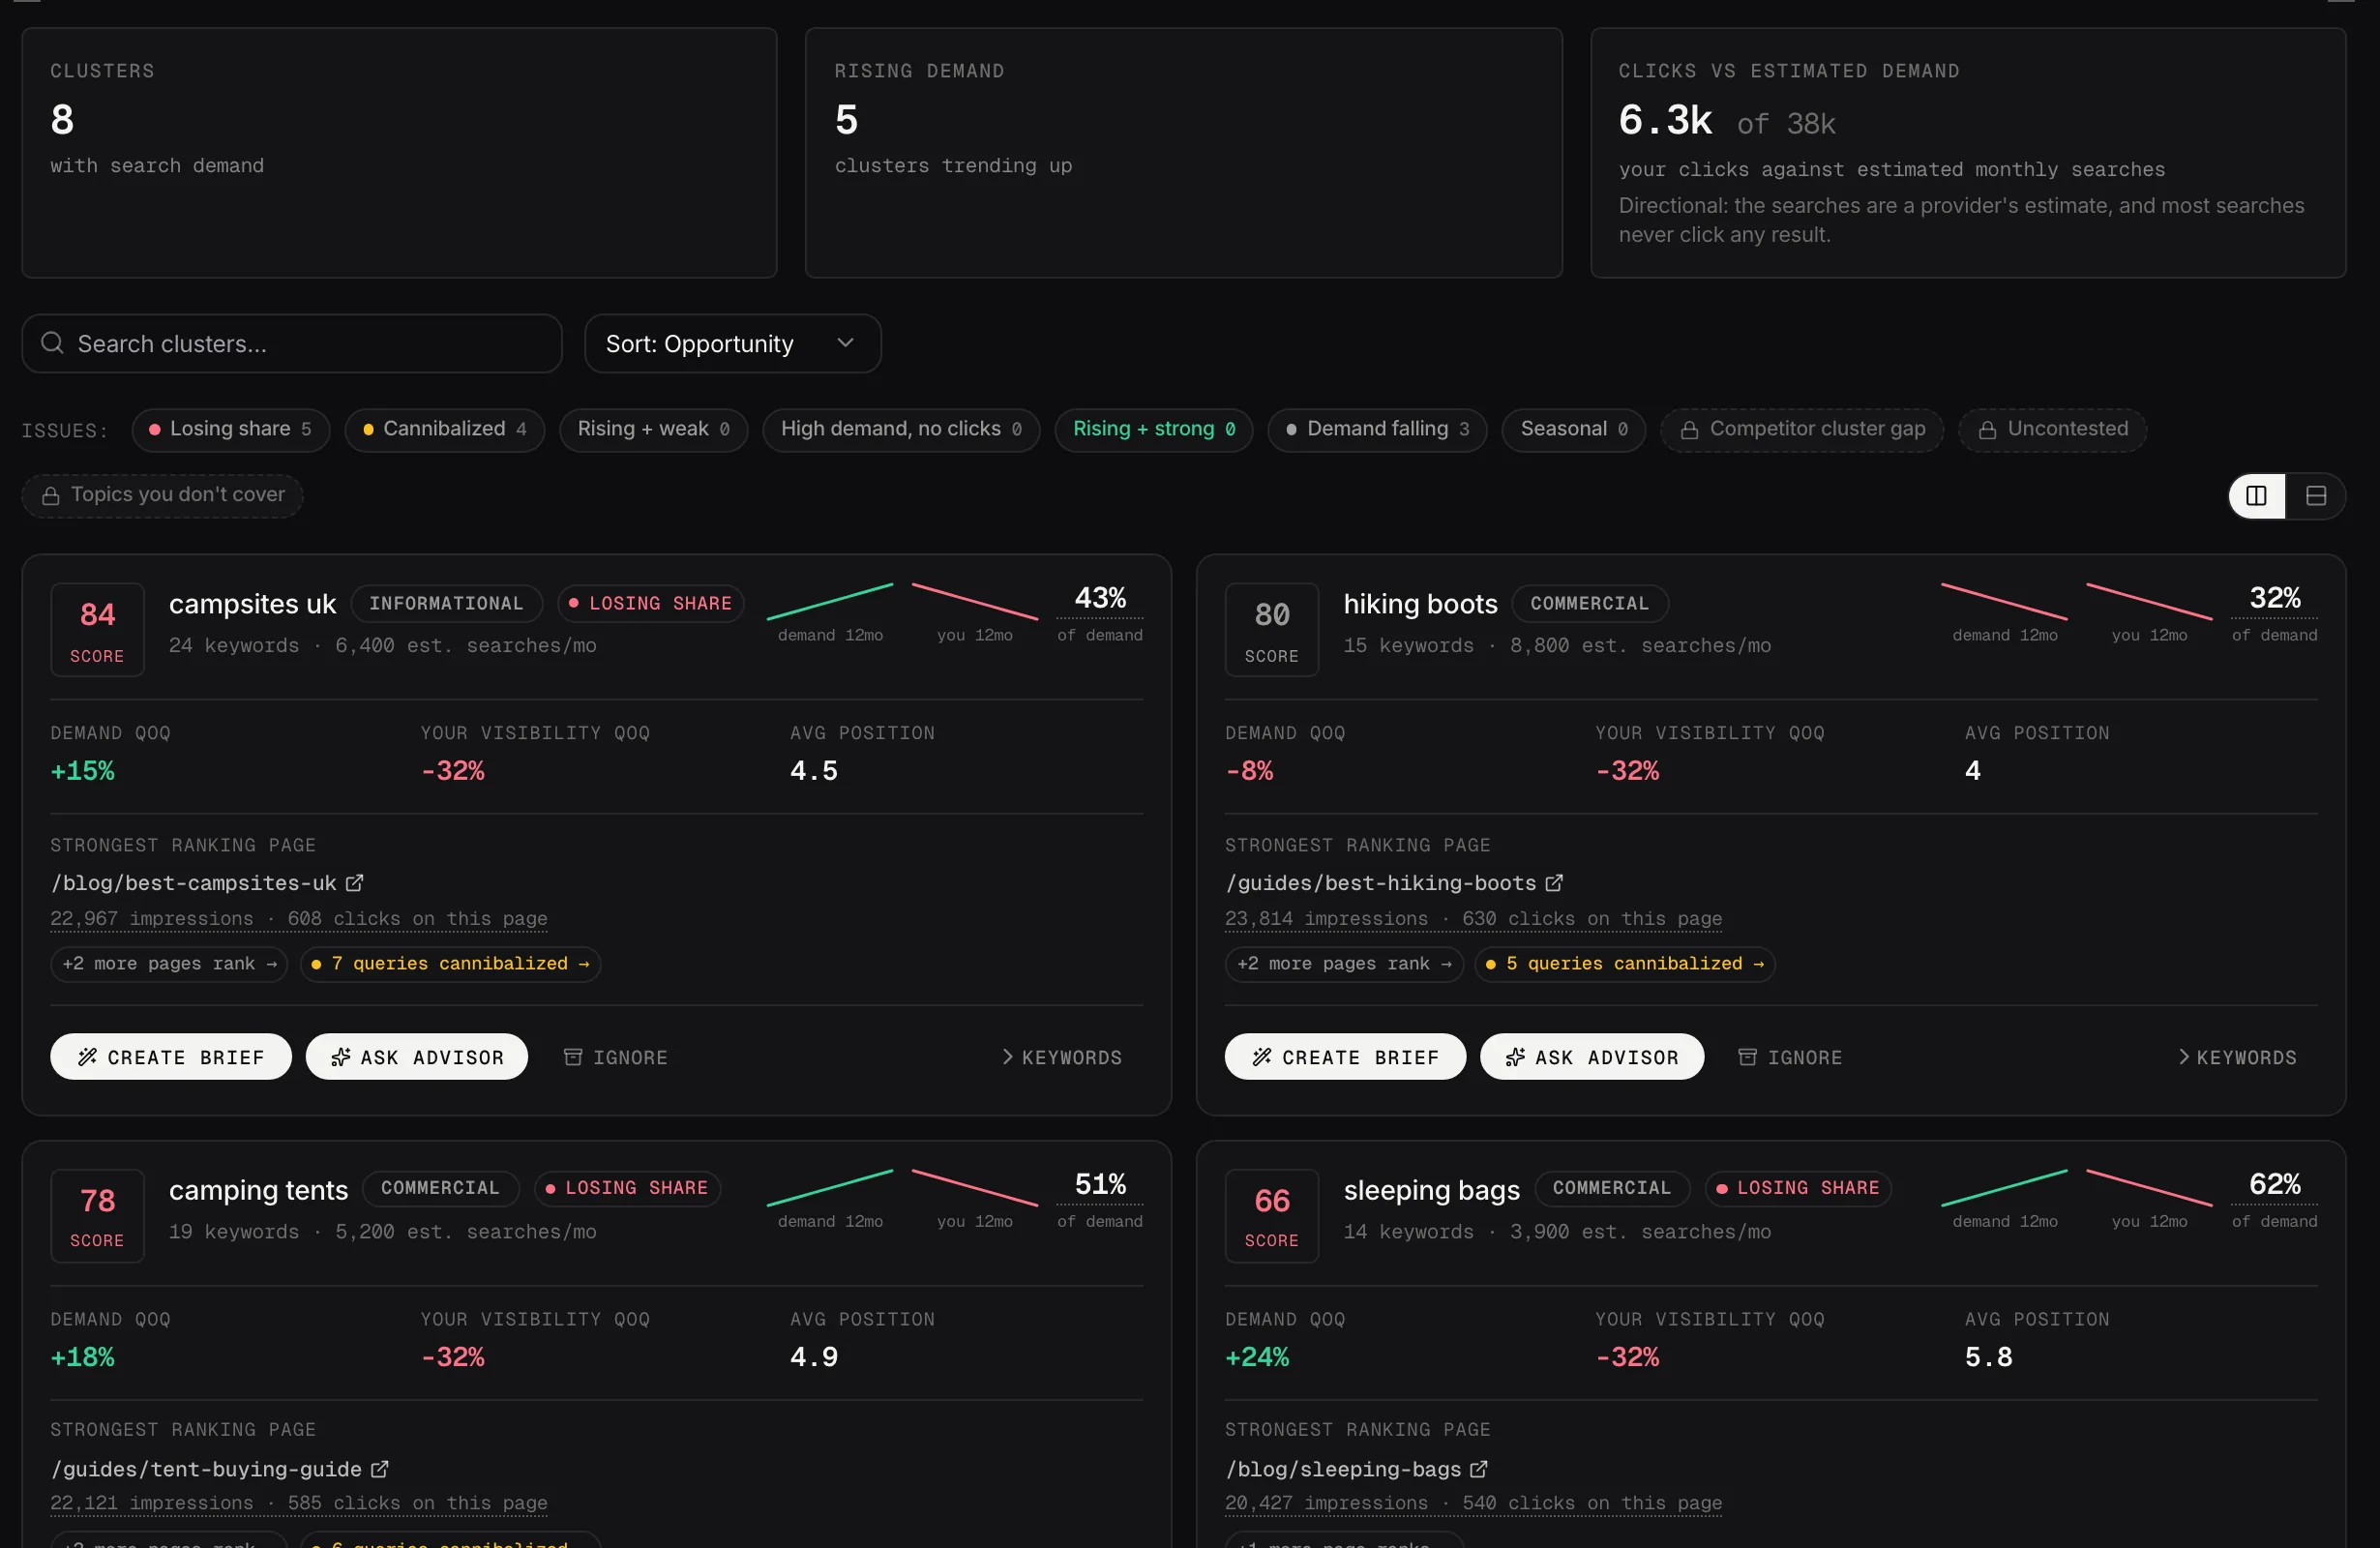
Each topic shows demand change, your visibility change and the page that ranks best for it.
Demo data