01
Written for
Client, executive, marketing or technical audiences. The numbers stay the same; the explanation changes to suit the reader.
A report full of charts still leaves somebody to explain what actually happened, and that’s usually the account manager.
Reporting assembles the period’s data first, with no AI involved in the figures. Once the numbers are fixed, Searchscope writes the narrative for each section in the tone you choose. The numbers are computed. Only the words are written.
BUILDING YOUR REPORT
Collect the period’s datadone
Write each section6 of 10
Title and executive summarywaiting
10 sections · about a minute
WRITTEN FOR
Northwood Outdoors · Aug 12 to Sep 8
Monthly search report
Executive Summarywritten
Search Performancewritten
Top Winswritten
Top Riskswriting now
Workspace Highlightsqueued
Demand & Trendsqueued
Competitive Landscapequeued
30-Day Action Planqueued
The audience sets the tone and preselects the sections that usually suit it. Then choose the sections you want included.
01
Client, executive, marketing or technical audiences. The numbers stay the same; the explanation changes to suit the reader.
02
7, 28 or 90 days, last month, or a custom range. Compare against the previous period or the same period last year.
03
Choose from nine report sections, with the executive summary included automatically: search performance, top wins, top risks, workspace highlights, Demand & Trends, Competitive Landscape, AI and brand visibility, actions completed and a 30-day plan.
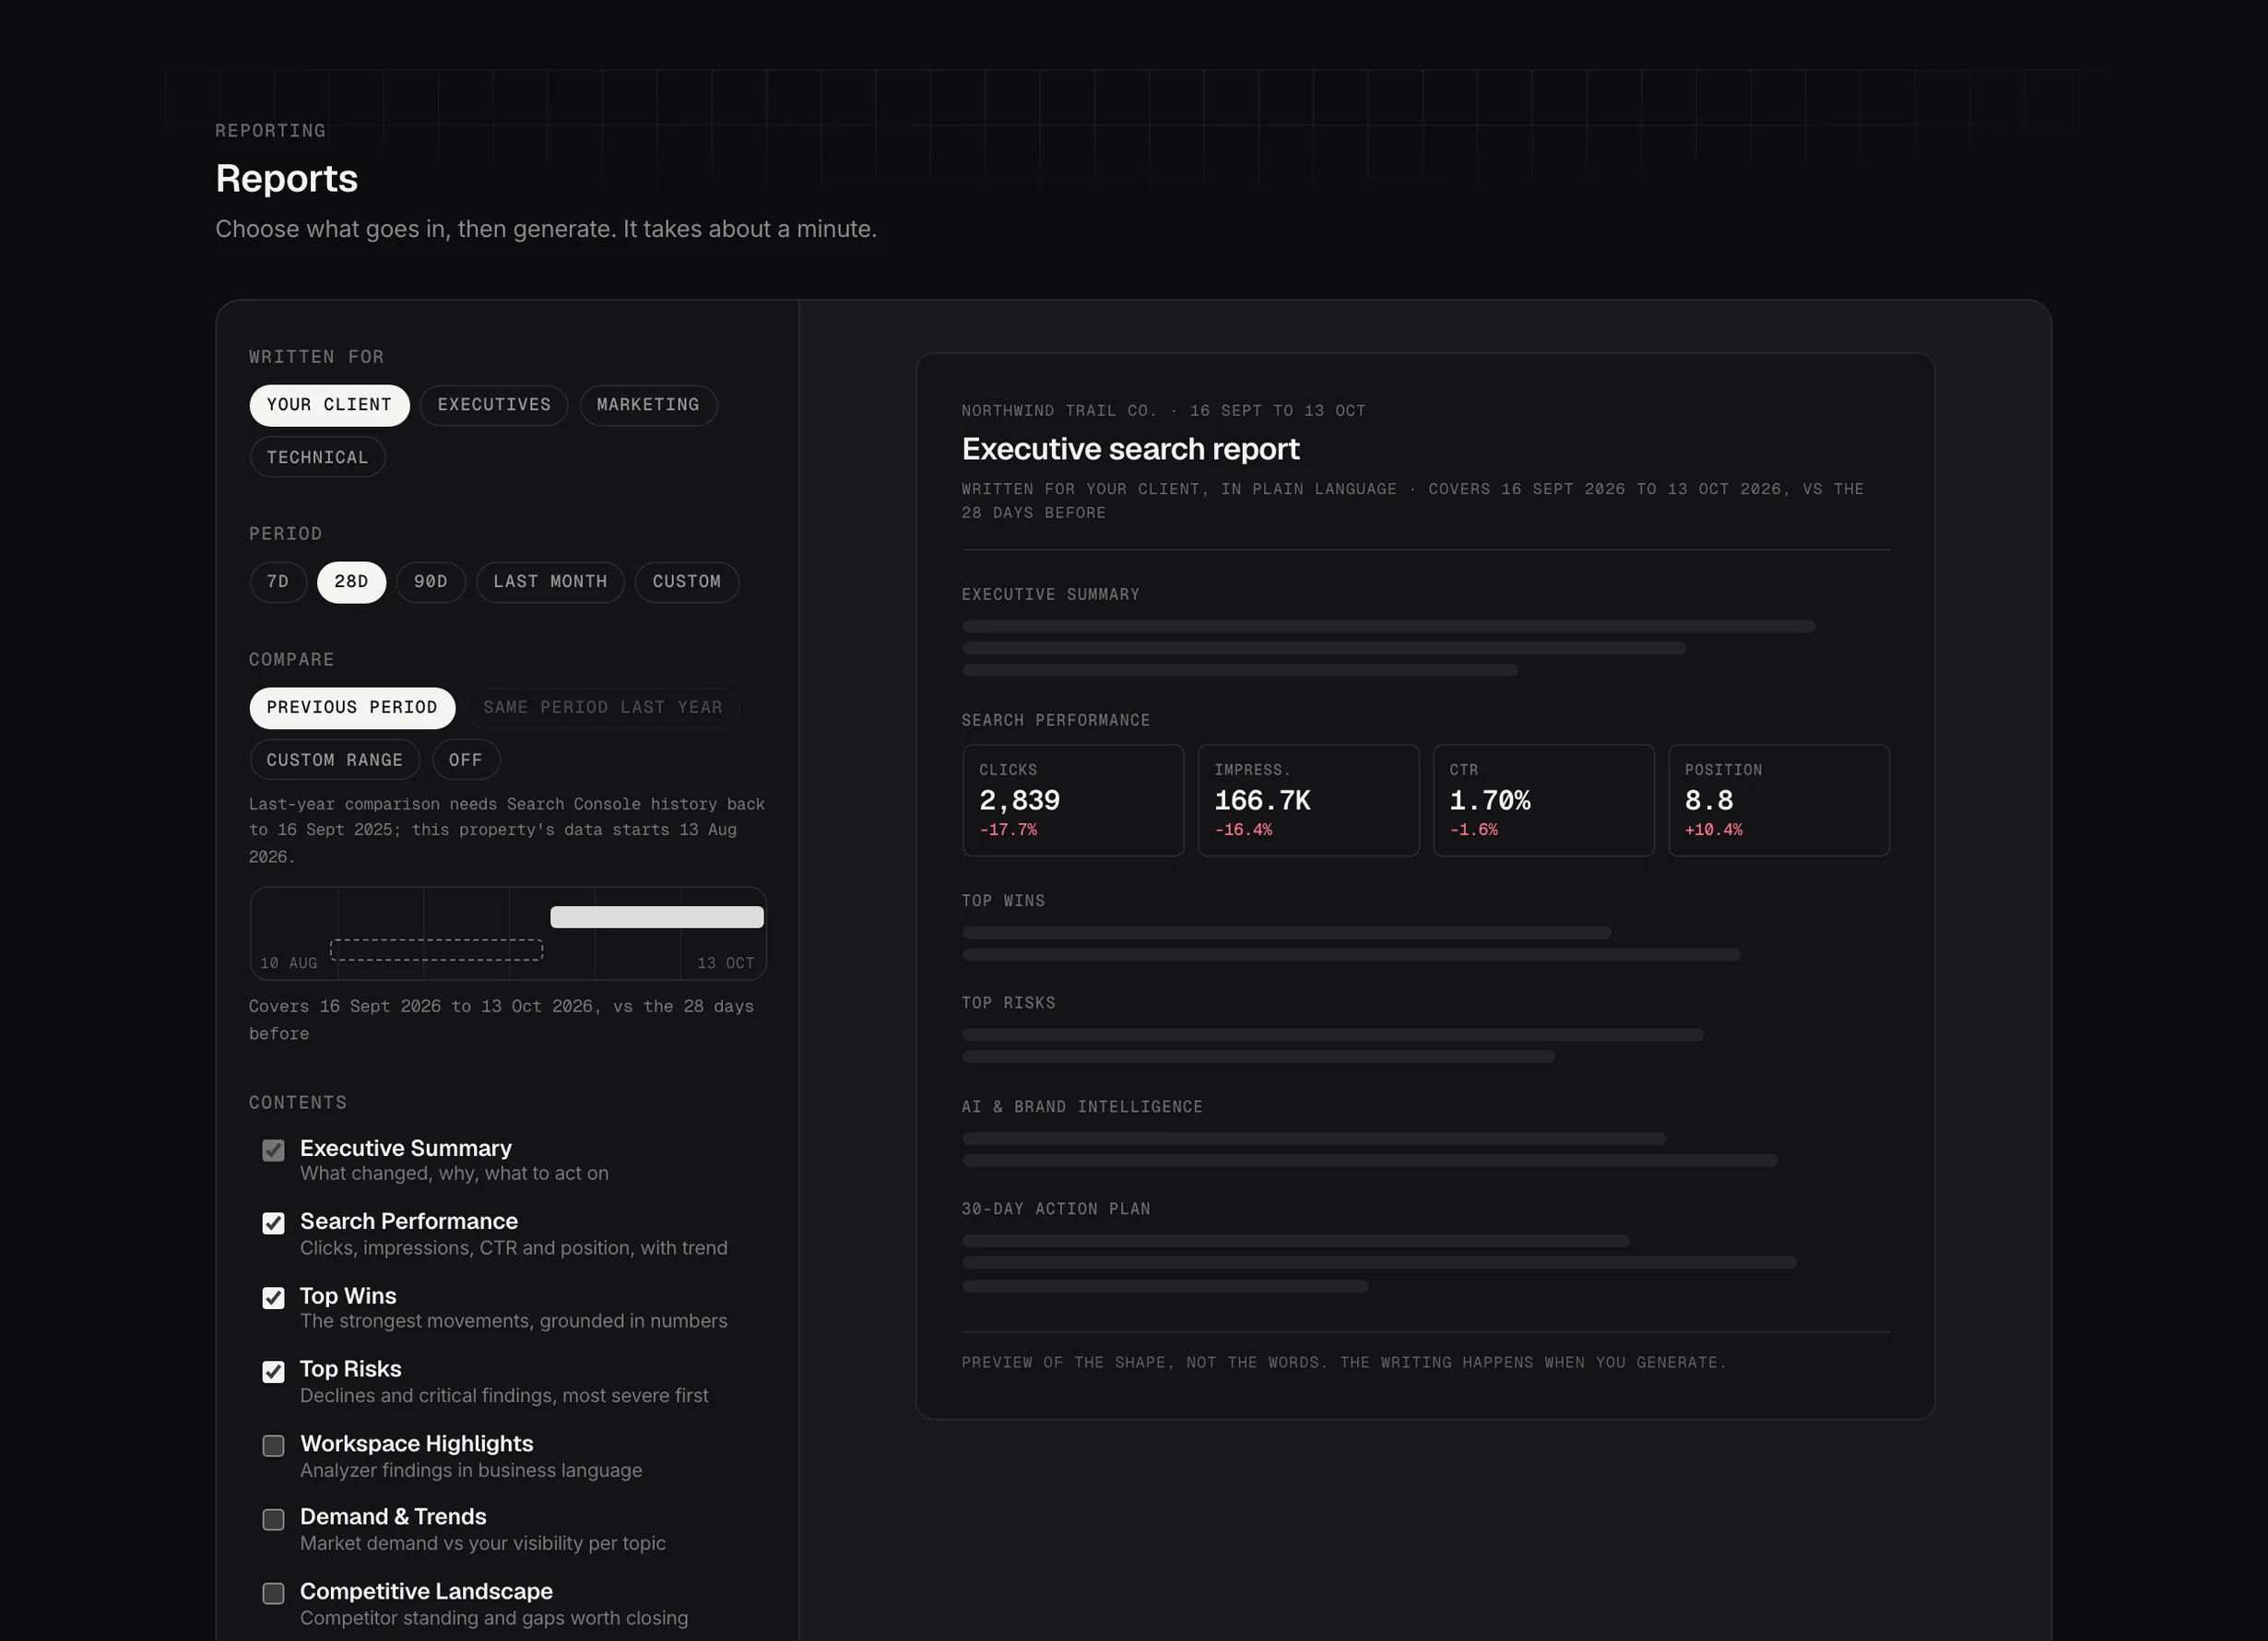
Composing a report: who it's for, the period, the comparison and the sections.
Demo dataThe order matters. Searchscope first gathers the report data from Search Console, analyzer findings, tracked competitors, demand clusters, AI and brand visibility, and changes marked as applied. No language model generates or estimates those figures.
Only once the data is assembled does the writing start. Each section is written from the figures already stored on the report, followed by a final pass for the title, executive summary, wins, risks and 30-day plan. Every chart, table and percentage on the page was computed, not generated.
01
If a section has no data behind it, Searchscope explains what’s missing and what needs to run rather than filling the space with generic commentary.
02
If Search Console history doesn’t reach far enough back to cover the comparison window, the comparison is dropped rather than reported against a partial period.
03
If Searchscope can’t produce the written sections, the report is marked as failed rather than presented as complete with unexplained tables.
A report written for a marketing manager rarely works for a finance director. Switching the audience rewrites every narrative section in the new tone and leaves the data, tables and charts exactly as they were.
01
Rewrite one section on its own, with an instruction if needed. It works from the data already stored on the report, so the underlying figures stay unchanged.
02
Add notes for the context that isn’t in any dataset: seasonality, a site migration, a change of priorities at the client.
03
A section can be hidden from the report and from every export, without generating it again.
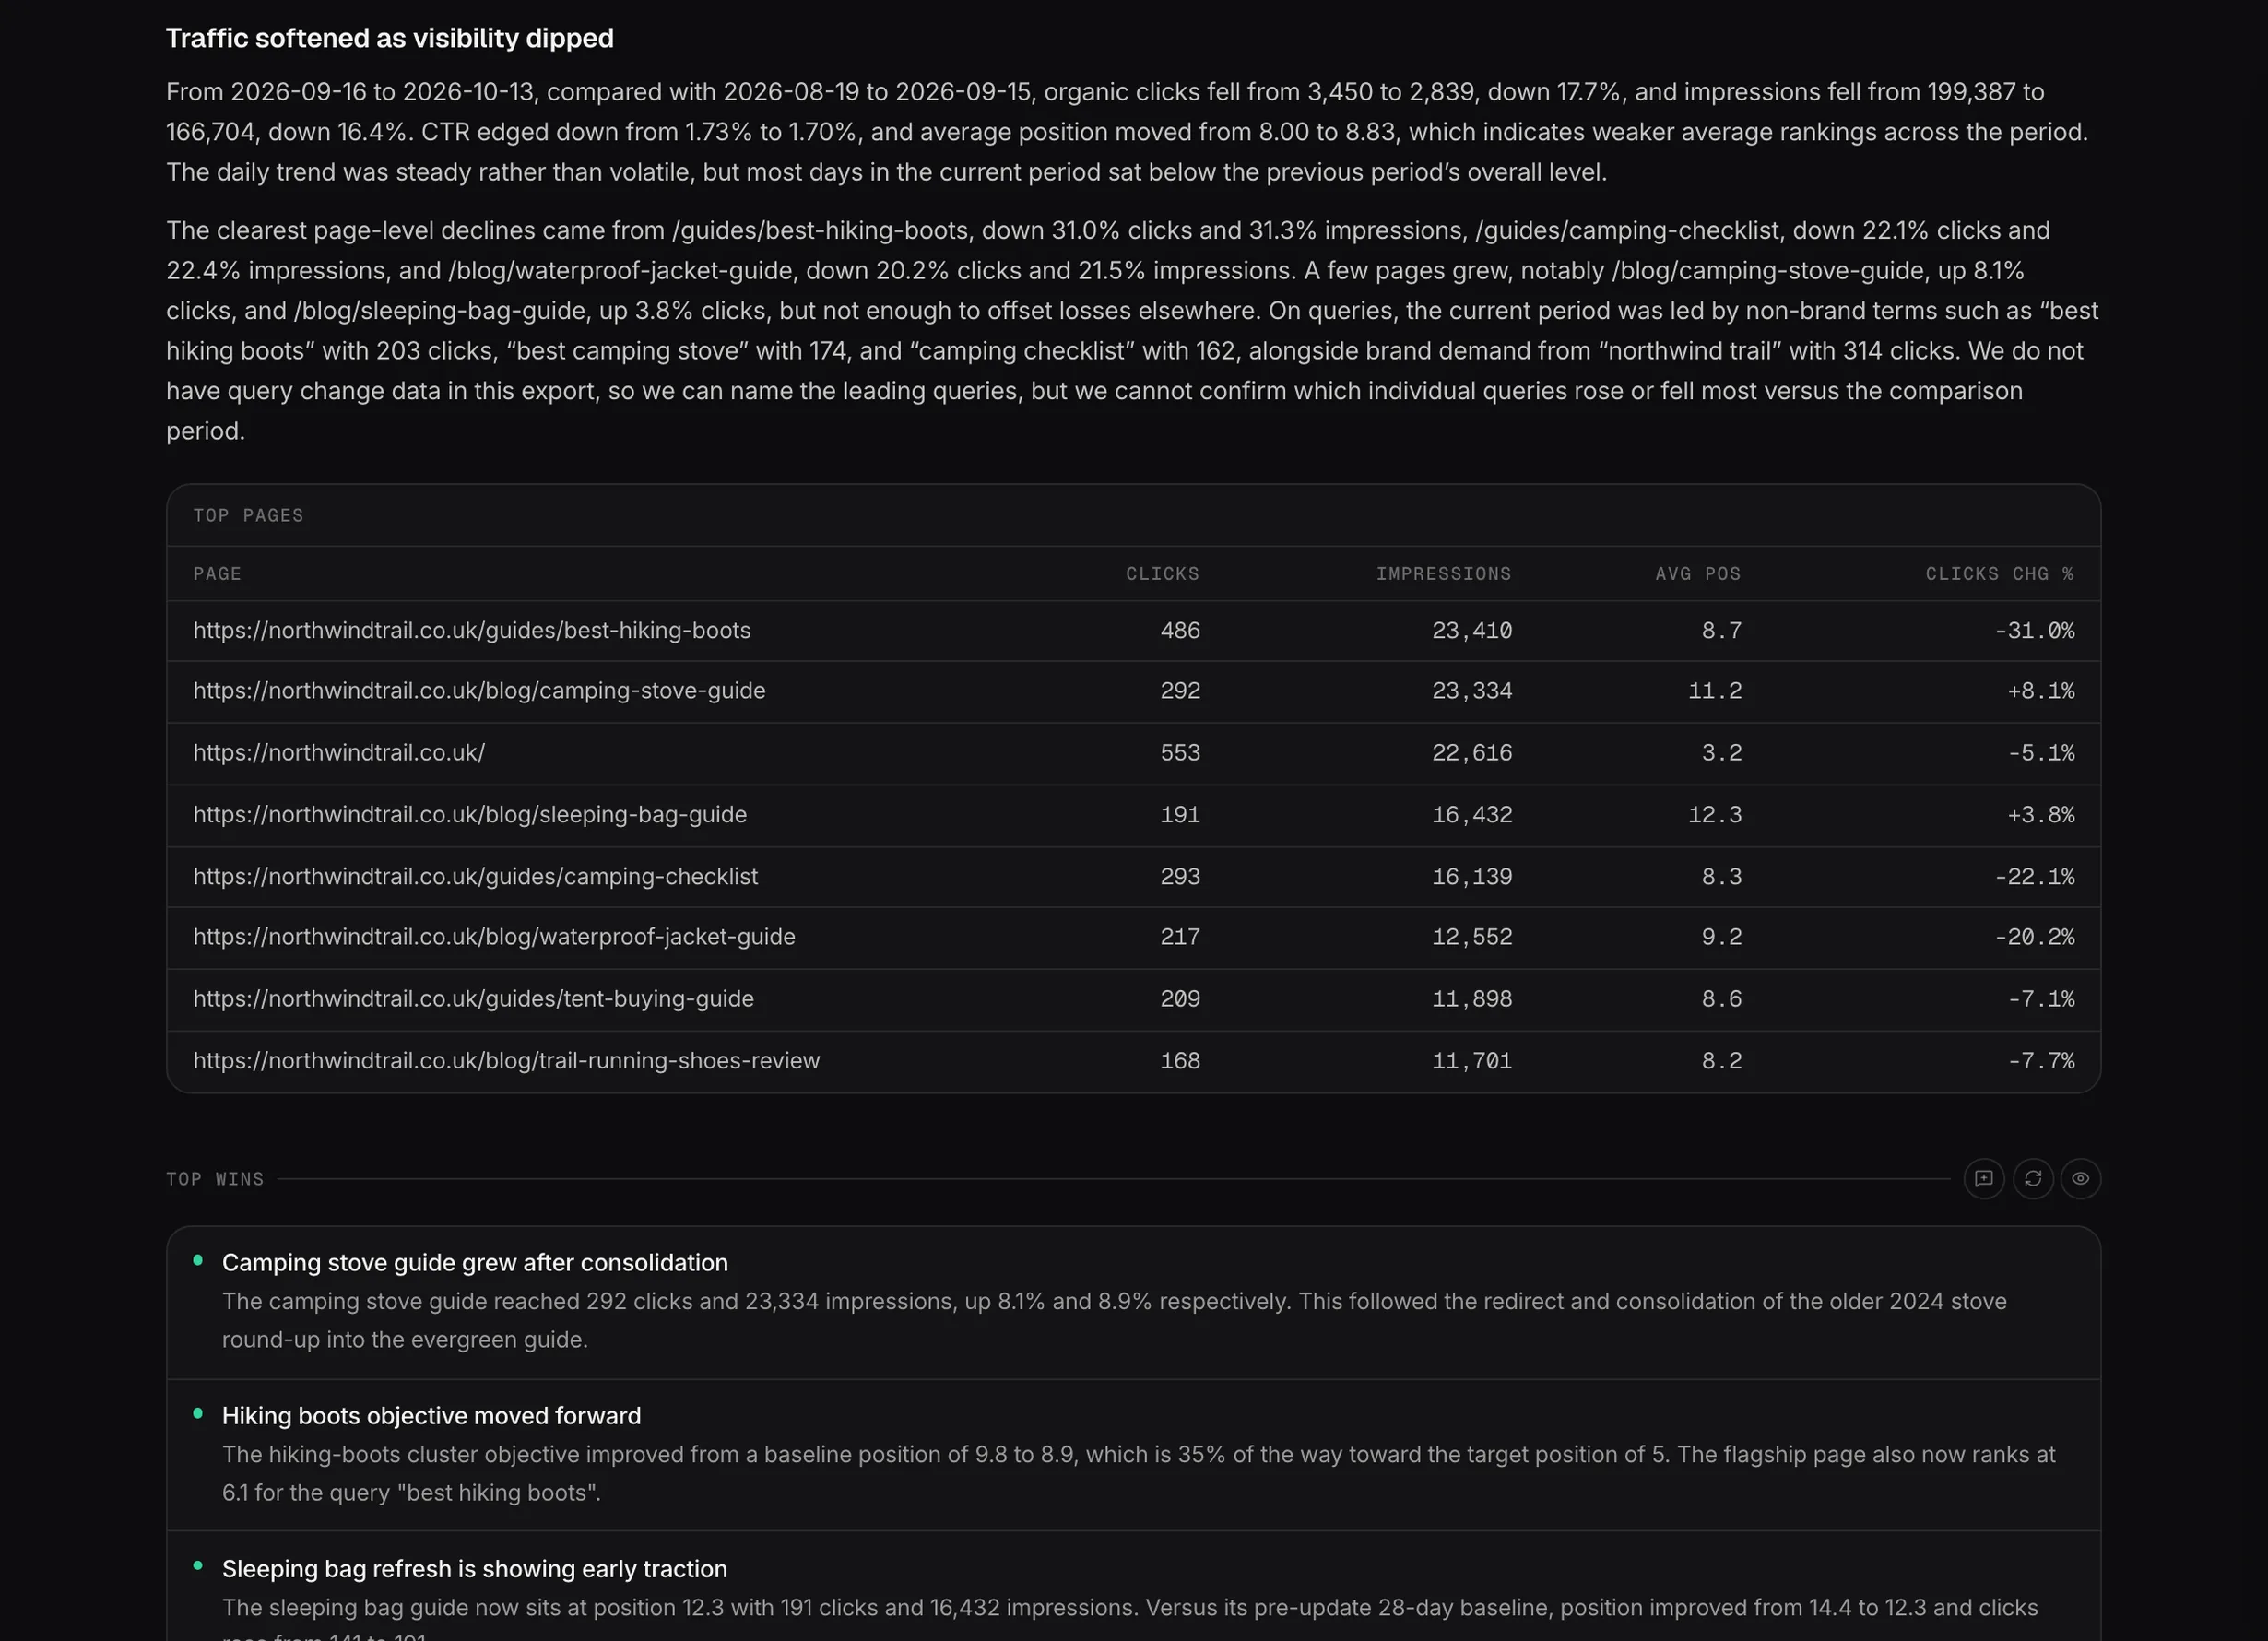
Inside a report: the numbers first, then the commentary written against them.
Demo dataGenerate the report, review it, then export it in the format you need.
01
A polished A4 report designed for sharing with clients and stakeholders.
02
The same report as an editable Word document, or as a deck with a slide per section and the plan broken out week by week.
03
One Excel file with a cover sheet for the period and a tab per dataset: Search Console, workspace findings, competitors, demand, brand and AI, objectives and changes. Pick the tabs the client should get.
Connect your site and generate a report from a real reporting period. Searchscope computes the numbers from your account data first, then writes the commentary around them.